In the following post, when calculating some functions, I was able to include detailed conditions by using 'If'. This time, let's check to what extent the conditions are being met by using 'If'.
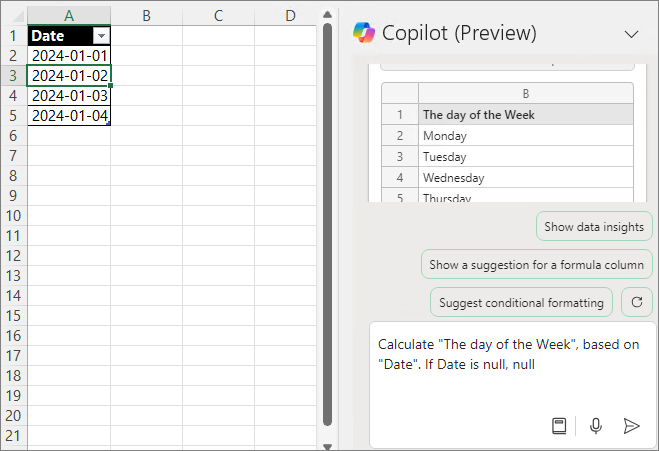
If you want to find the day of the week based on a date, you can input the prompt as follows.
Calculate "The day of the Week", based on "Date".
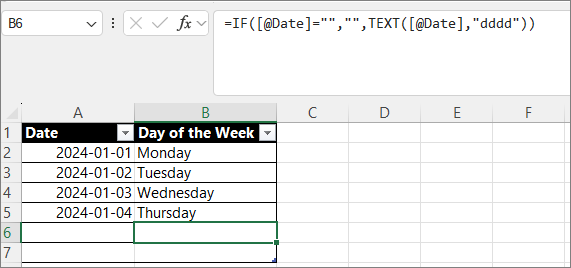
Formulate the equation as shown below.
If A is null, adding null results in the following:
Create it in the following format:
Null values are satisfied and calculated.
You can create various conditions with this pattern, such as for errors or incorrect formats.
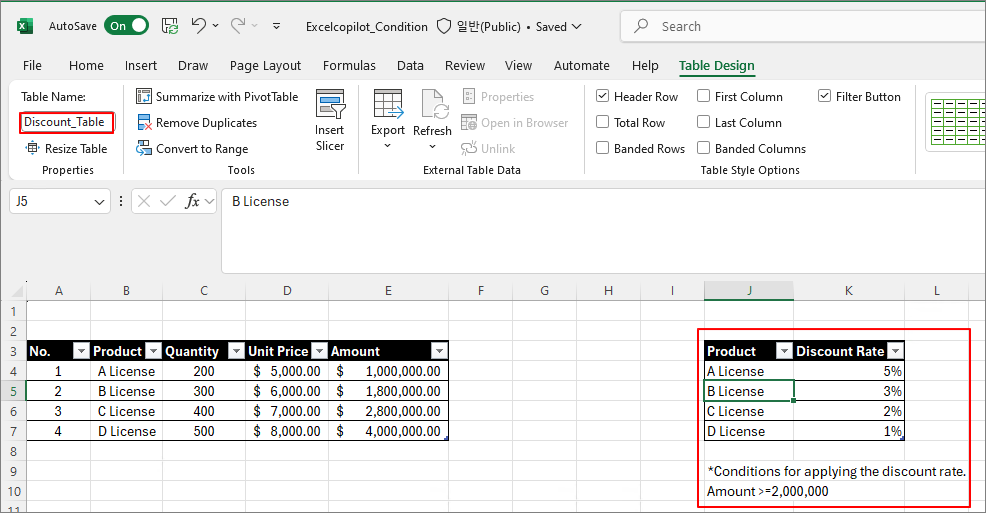
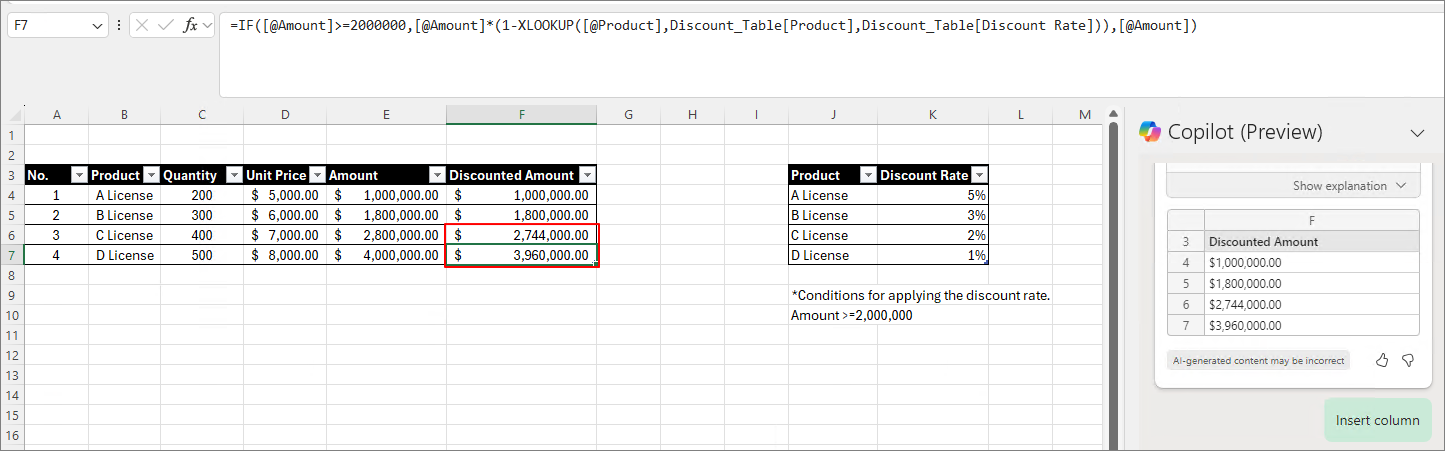
Prompt 2. If A >= X, apply discount of Table (Apply the discount rate)
There is a sales invoice as shown below, and on the right, there is a discount rate table by product. Let's create the Amount by applying the conditions from the Discount_Table.
If Amount >= $2,000,000, apply discount of Discount_Table
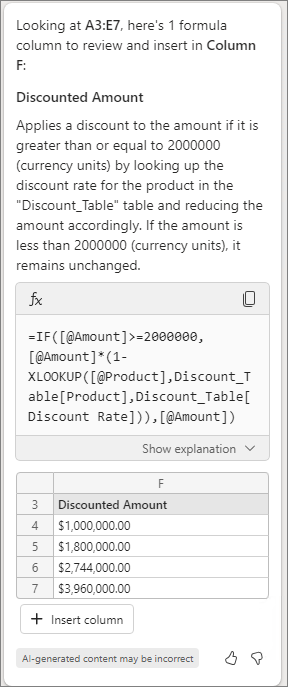
Generate the formula as shown below.
You can see that the Discounted Amount is calculated as follows.
By applying this, it is expected that various invoices can be created more easily than before.
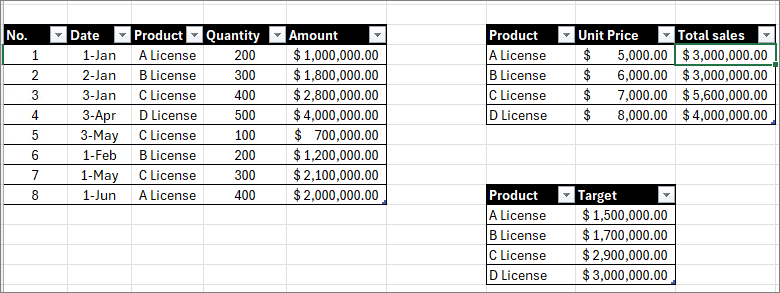
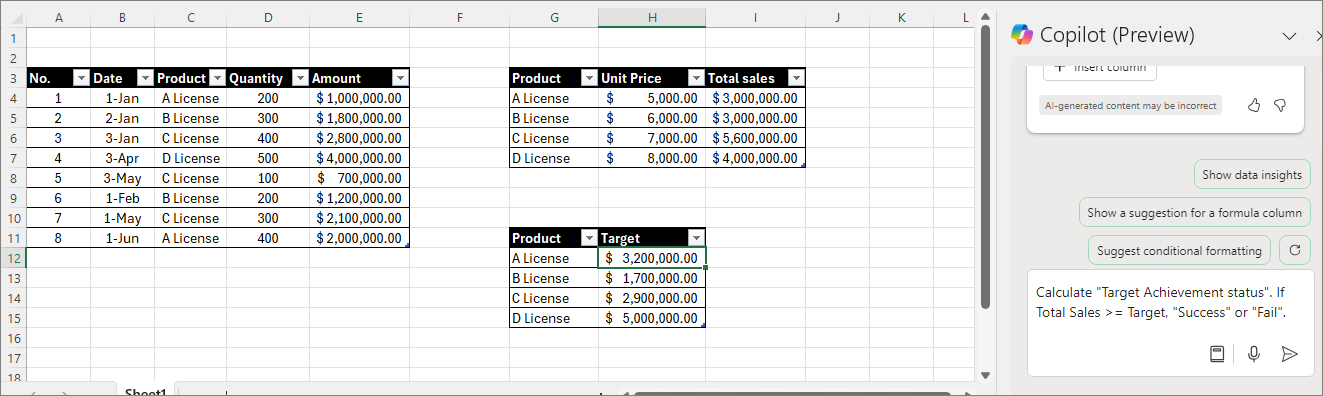
Prompt 3. Calculate "Target Achievement status". If Total Sales >= Target, "Success" or "Fail".
This time, as shown below, Table 1 contains sales records, Table 2 contains product performance, and Table 3 contains product targets
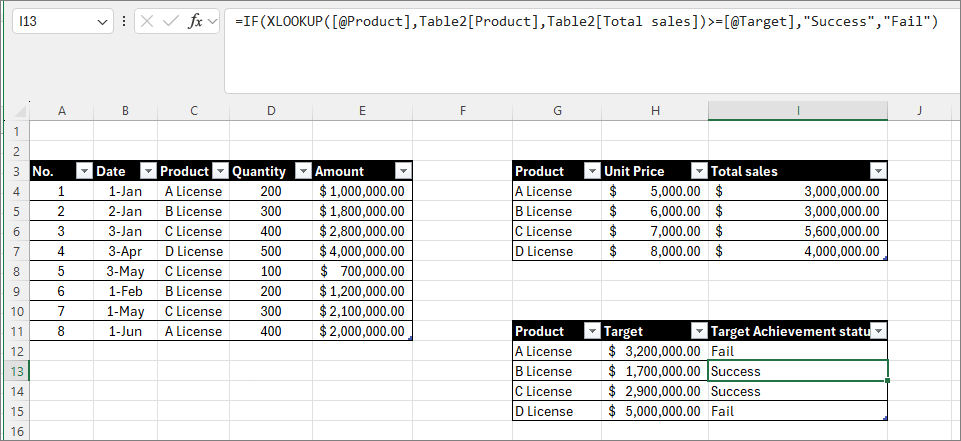
Calculate "Target Achievement status". If Total Sales >= Target, "Success" or "Fail".
Although Table 2 wasn't mentioned, it found the target from Table 2 and performed the calculation. It seems that the recent Excel Copilot remembers the prompts I gave earlier and uses them to generate formulas.
Result
As with other products, it appears that Copilot in Excel is significantly influenced by the Chat History.
Therefore, there are times when even a simple input is enough for it to reference and retrieve data, while other times, even with detailed instructions, it fails to generate the formula. I believe that the more you work with Copilot, the easier it becomes to create formulas efficiently.
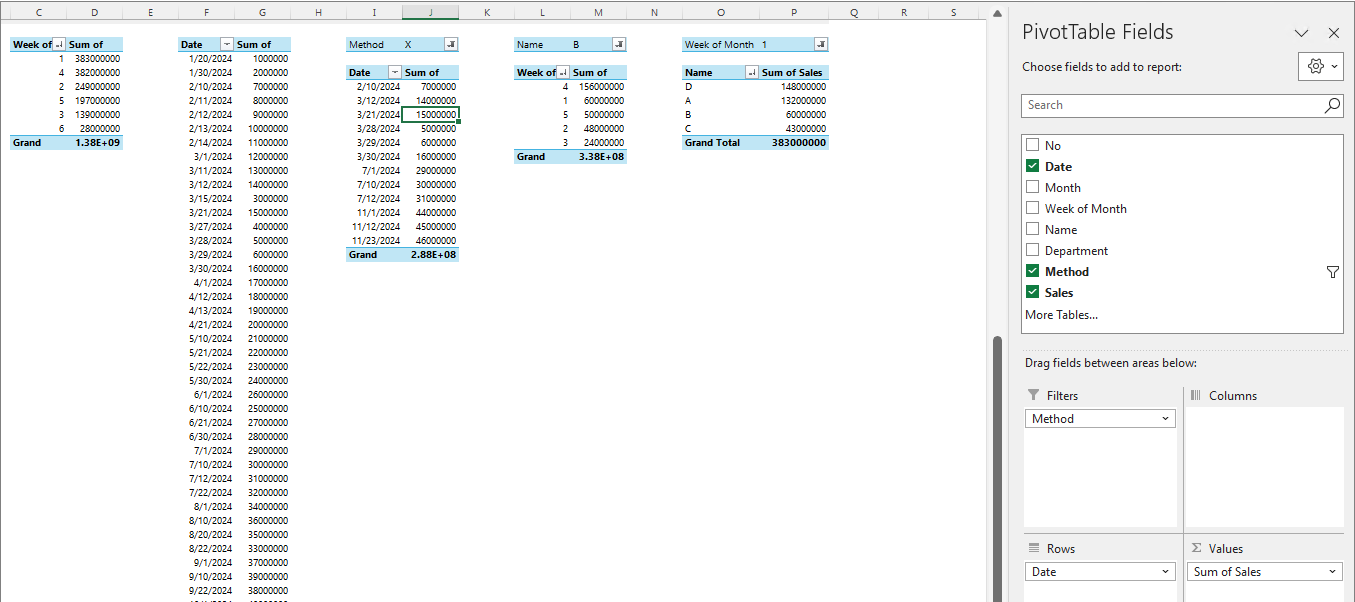
Let me introduce two useful prompts for creating pivot charts and pivot tables: "Show data insights" and "Add all insights to grid." These prompts are already quite well-known, but they are so helpful that I decided to include them in the "Useful Prompt" series. As this series grows longer, I believe that some people might eventually use it as a resource to organize their work.
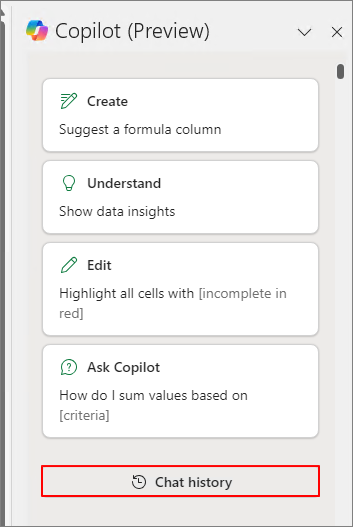
After selecting the table you want to analyze, click or input "Show data insights."
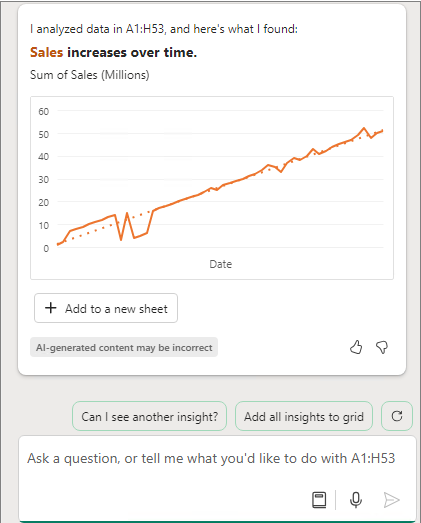
When you click "Add to a new sheet," the corresponding pivot chart and table will be generated on a new sheet. If you want to receive different data insights, click "Can I see another insight?"
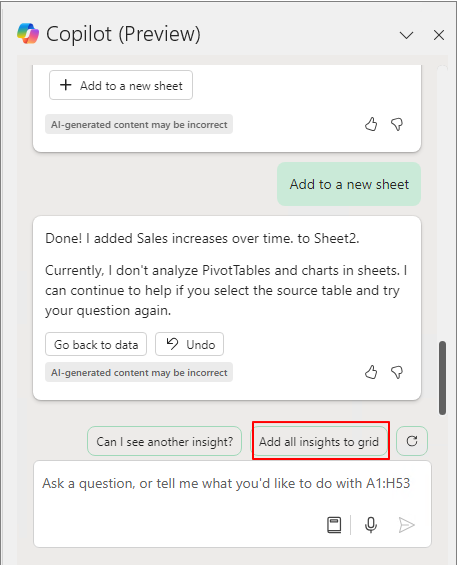
When you click "Add to a new sheet," a simple prompt will generate the pivot chart and pivot table.
Prompt 2. Add all insights to grid
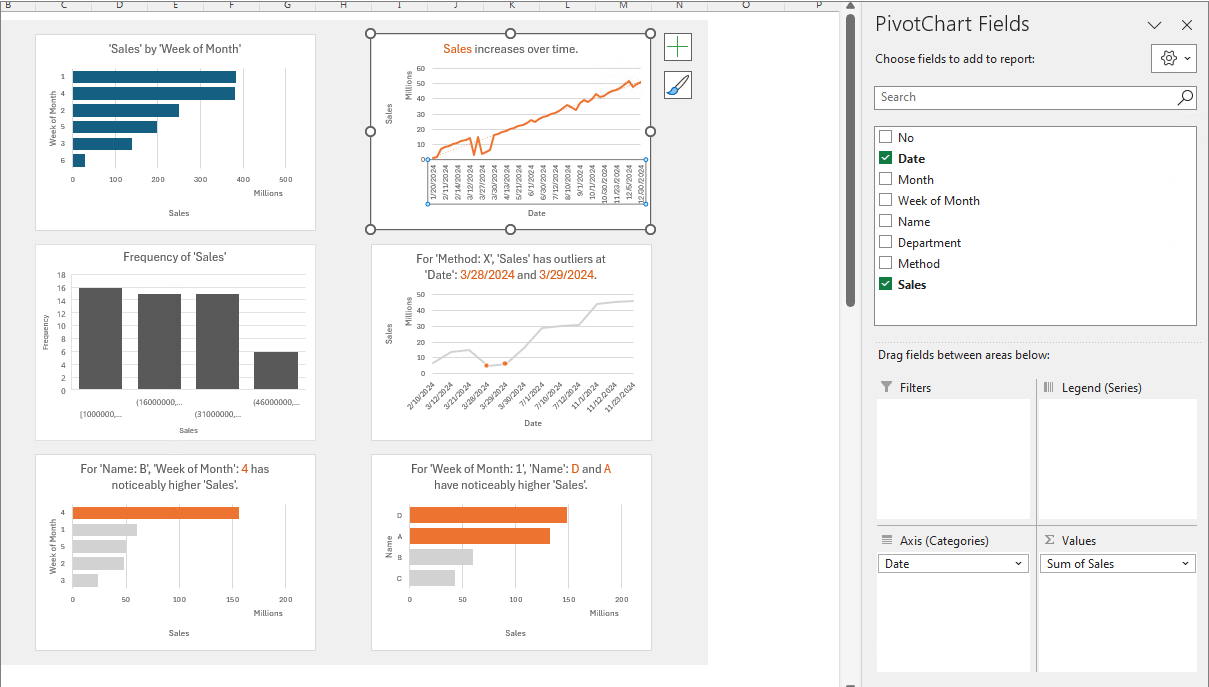
When you click "Add all insights to grid,"
various pivot charts and
pivot tables will be generated simultaneously.
Users who have struggled with creating pivot charts and pivot tables can now easily do so using simple prompts.
Expanded data structure support and comprehensive answers in Copilot in Excel
Users are no longer limited to using Copilot in Excel only in Excel tables, because Copilot in Excel now works on data ranges resembling tables with a single row of headers on top. This saves time by eliminating the need to format data. so users can start analyzing with Copilot right away. This feature started rolling out this month.
In addition, the edit box is now available on any Excel worksheet, regardless of the selected cell. Copilot will reason over the nearest table, or data range resembling a table, to the user’s selected grid area on the same worksheet. This enables users to interact with Copilot immediately, regardless of their position in the worksheet, saving time and increasing productivity. This feature started rolling out this month.
Copilot in Excel now also provides more conversational and comprehensive answers to a wide array of Excel-related questions. When prompted, users can now receive step-by-step instructions including formula examples, or can see corrections and explanations of formula errors. This feature started rolling out this month.
In my personal opinion, I think it has now... become somewhat useful. I’ll show you how you can utilize it to some extent with a specific prompt pattern.
To use Copilot in Excel, the file needs to be saved on OneDrive or SharePoint, and auto-save must be activated. For collaborative editing, auto-save must be enabled. In a way, this is similar to the concept of how Copilot works in conjunction with Pilot for collaborative editing.
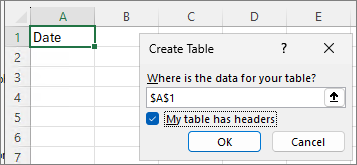
Inserting Tables
Copilot operates based on tables. Initially, it only worked within a table, but now it can reference and operate using other tables like a database.
Insert - Table
OK
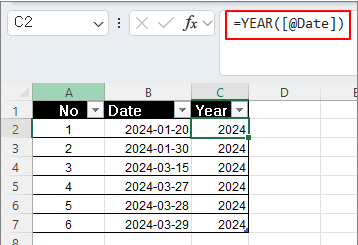
Prompt 1. Calculate A based on B
Let's calculate the year based on the date.
Calculate Year Based on Date.
Insert column
Confirm result
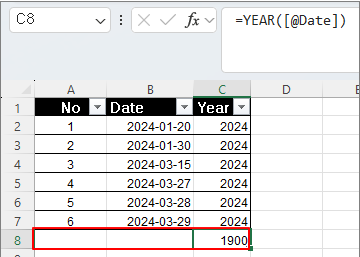
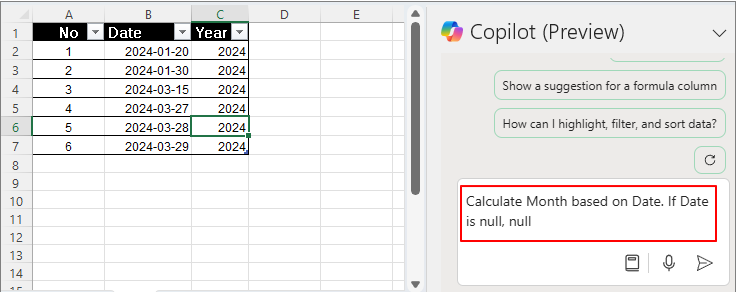
Prompt 2. Calculate A based on B. If A is null, null
It's similar to prompt 1, but with an additional condition. If A is null, it should be displayed as null.
If this condition is not met, and the date is null, it will be displayed in the following format:
This time, we'll calculate the month based on the date.
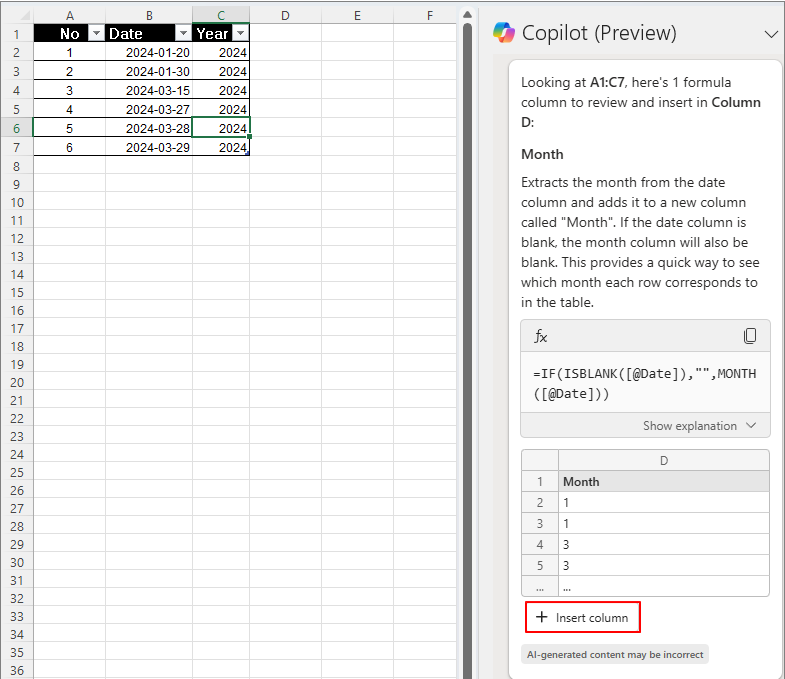
Calculate Month based on Date. If Date is null, null
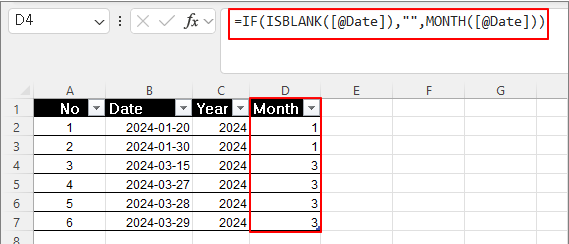
Insert column
The month is calculated as shown below. You can see that if the date is null, it is displayed as null.
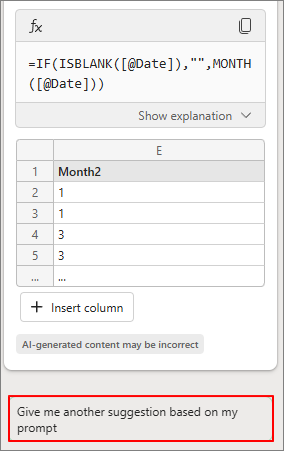
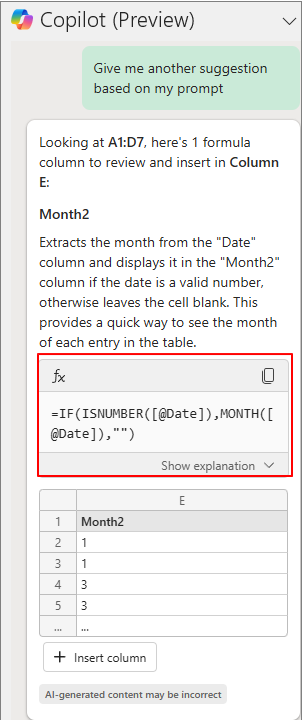
If you click on "Give me another column suggestion" instead of "Insert column," it will provide an alternative approach using a different formula.
It suggests a different formula as shown below.
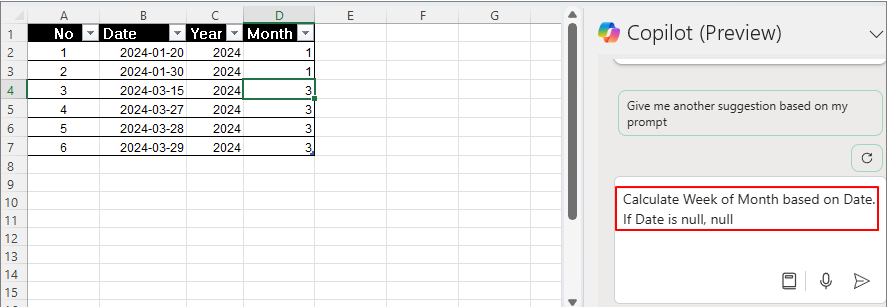
Using the same approach, let’s calculate the week number.
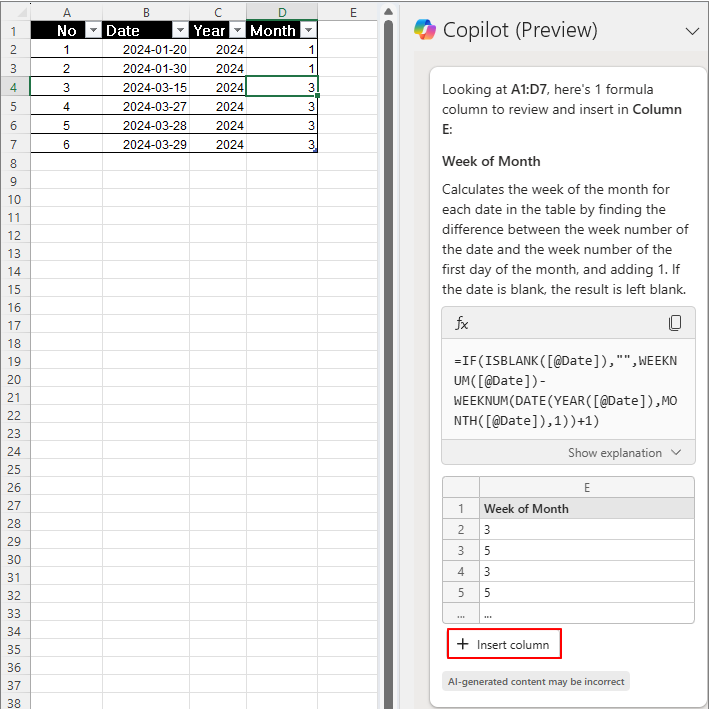
Calculate Week of Month based on Date. If Date is null, null.
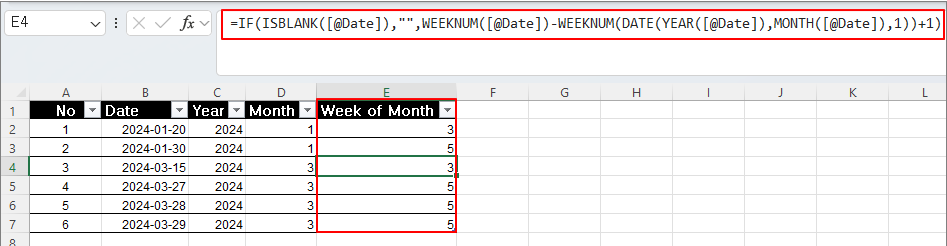
Insert column
Confirm result
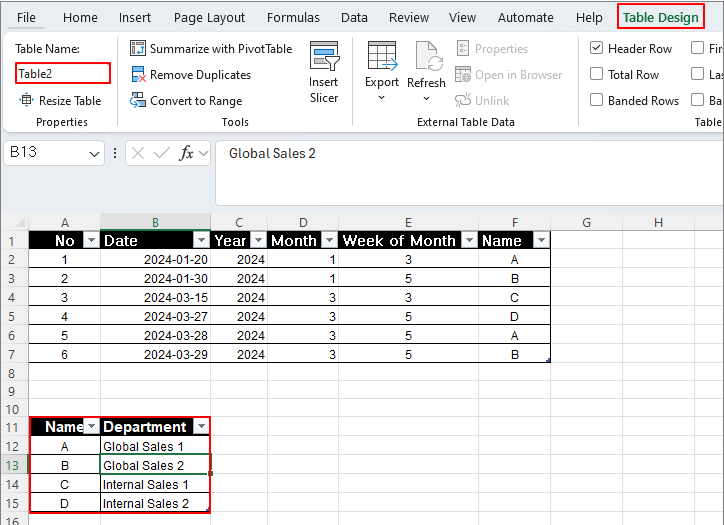
Prompt 3. Calculate A, Matching B based on C
This time, let's retrieve the department corresponding to the name based on Table2, as shown below.
(This can be done even if it’s not on the same sheet.)
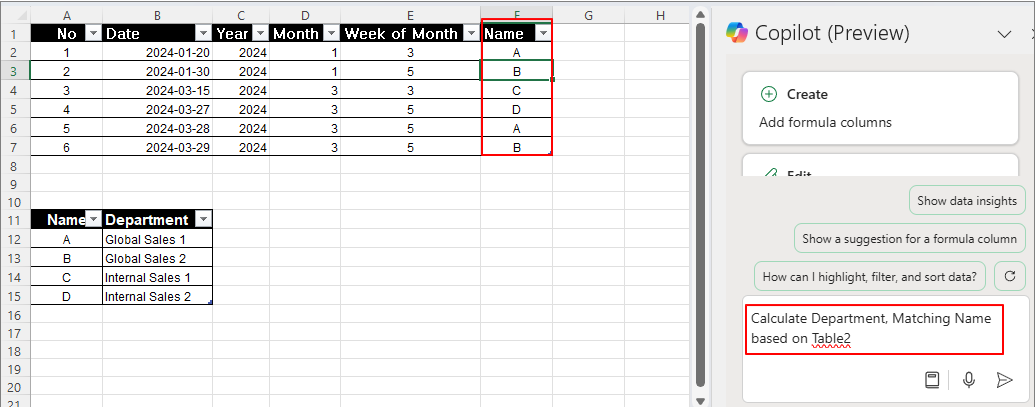
After selecting the first table, enter the following prompt:
Calculate Department, Matching Name based on Table2
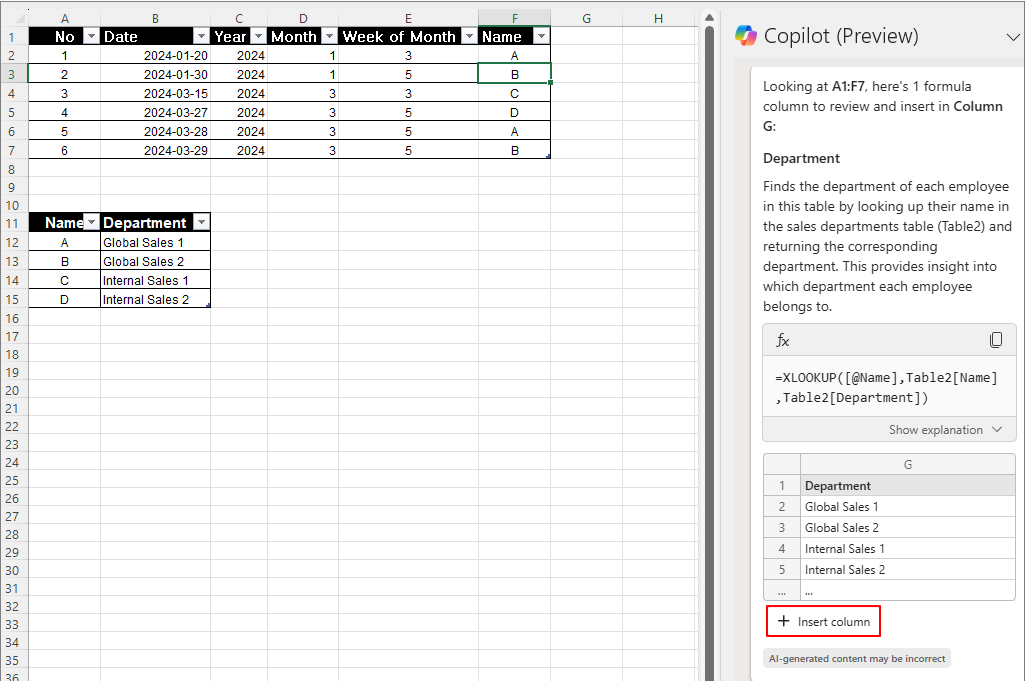
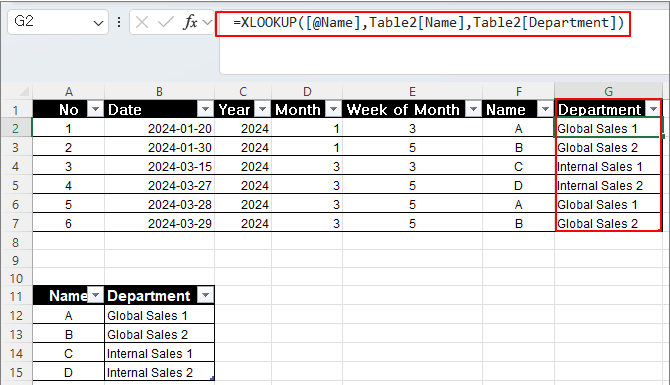
Insert column
You can see that the department corresponding to the name is retrieved using the XLOOKUP function.
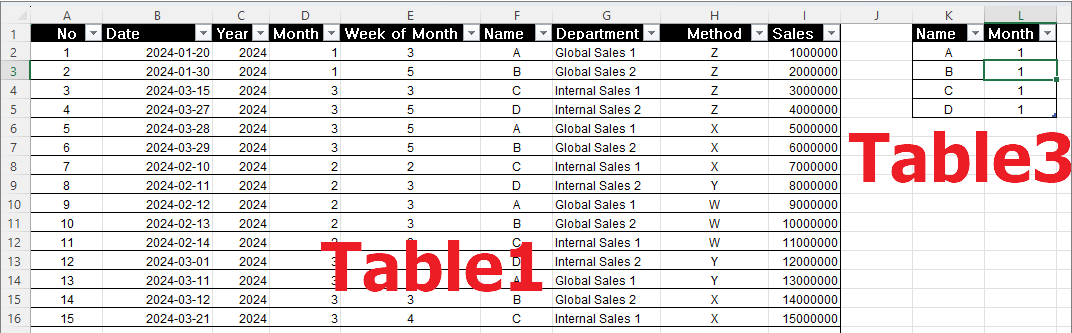
Prompt 4. Calculate Method Z, X, Q, Y Matching Name, Month based on Table1
Table1 is a performance table by sales representatives.
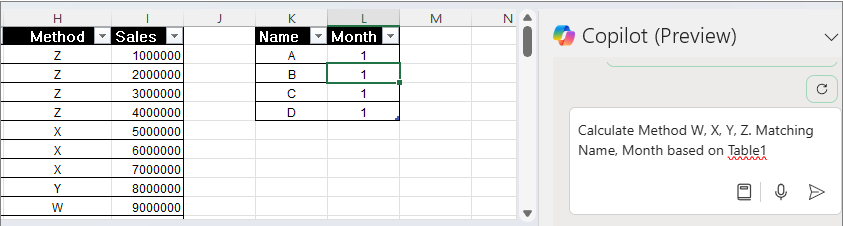
Let’s use a prompt in Table3 to retrieve the relevant performance data.
By entering the prompt below, you can calculate the monthly performance of sales representatives by method.
Calculate Method W, X, Y, Z. Matching Name, Month based on Table1
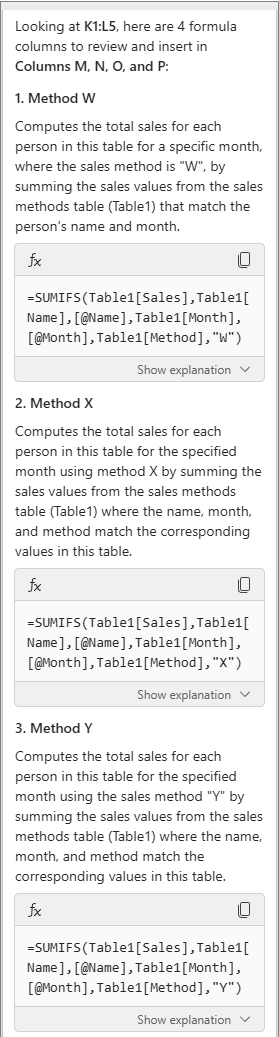
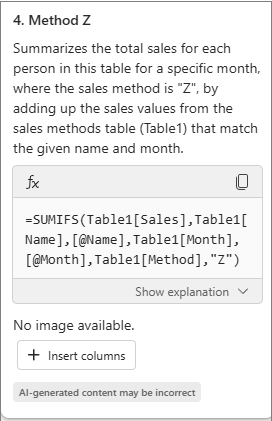
It suggests four formulas at once, as shown below.
As of July 27, 2024, you can add formula-based aggregation by up to four different attributes.
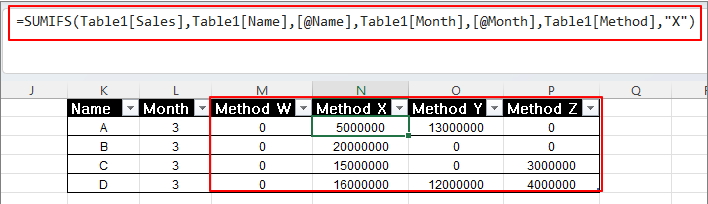
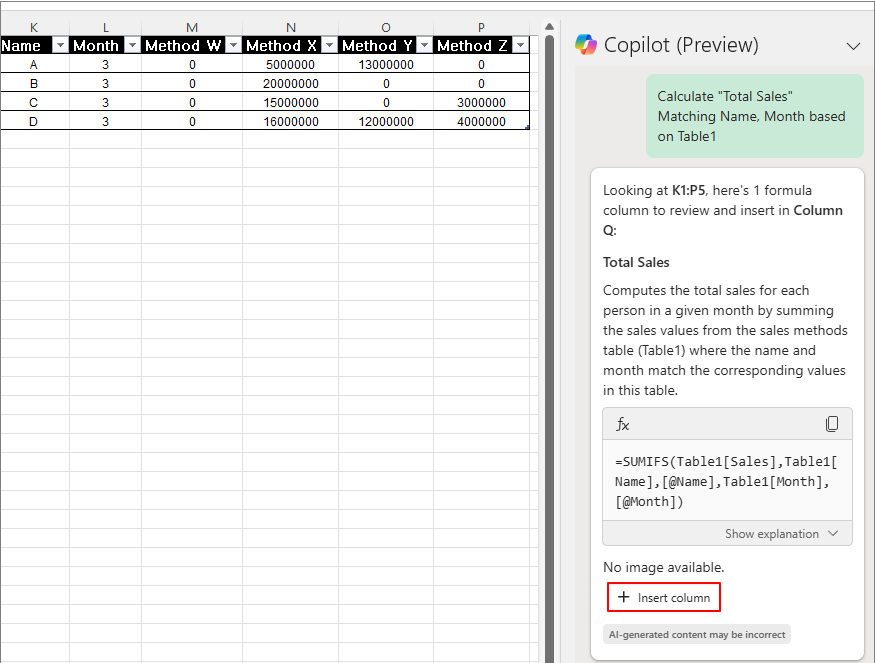
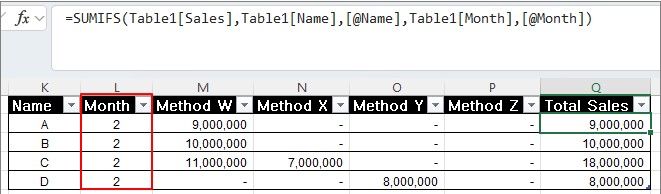
You can calculate the total monthly sales performance using the following prompt.
Calculate "Total Sales" Matching Name, Month based on Table1
Insert column
Table1의정보를기준으로 Month의값을참고하여각각의실적을계산합니다.
Based on the information in Table1, calculate the performance for each month by referencing the values in the Month column.
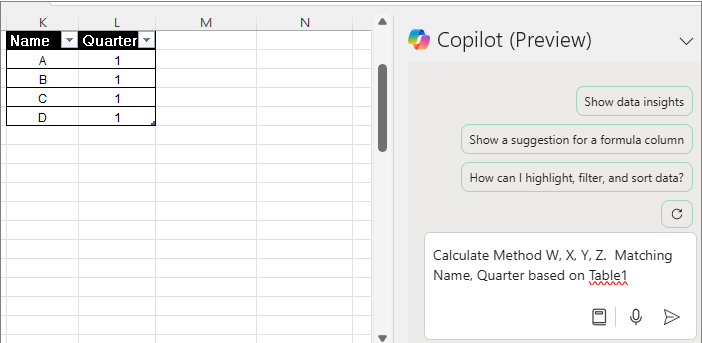
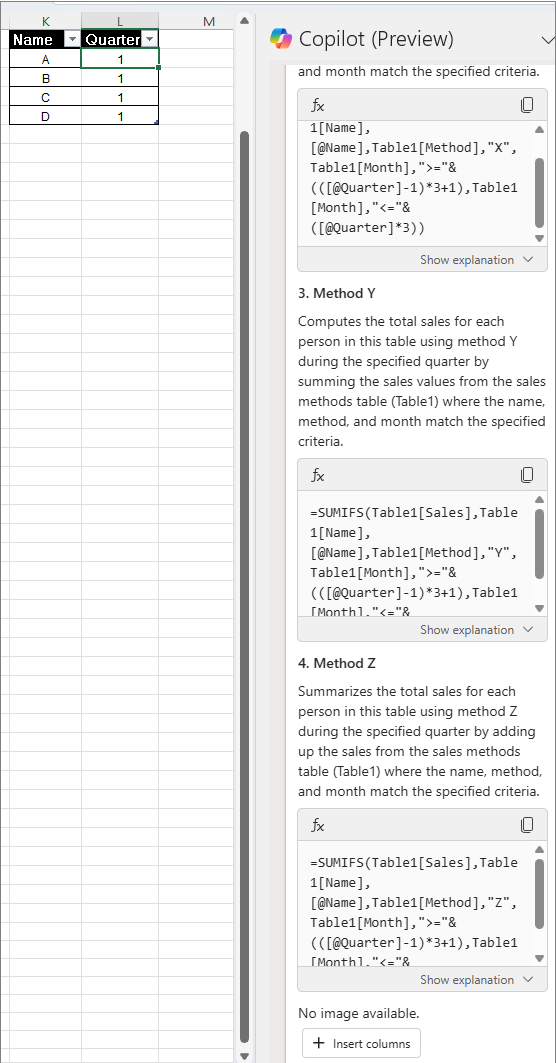
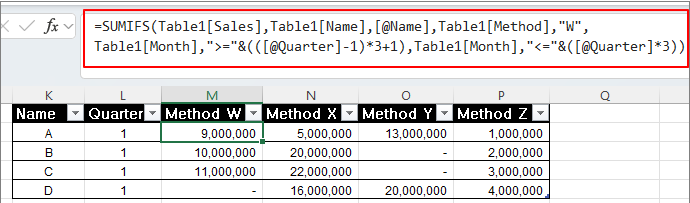
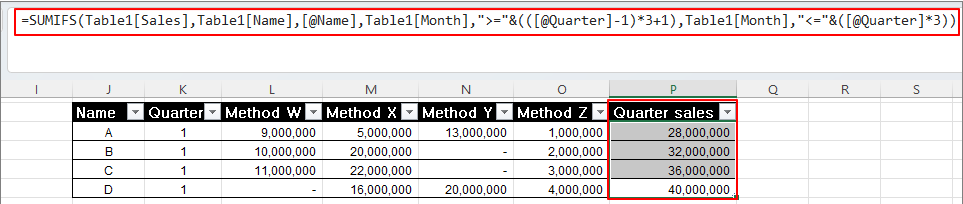
Calculate Method W, X, Y, Z. Matching Name, Quarter based on Table1
Insert column
A complex formula is completed to calculate the quarter.
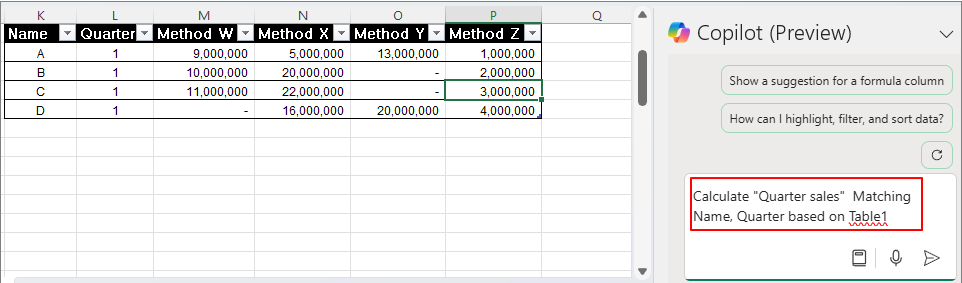
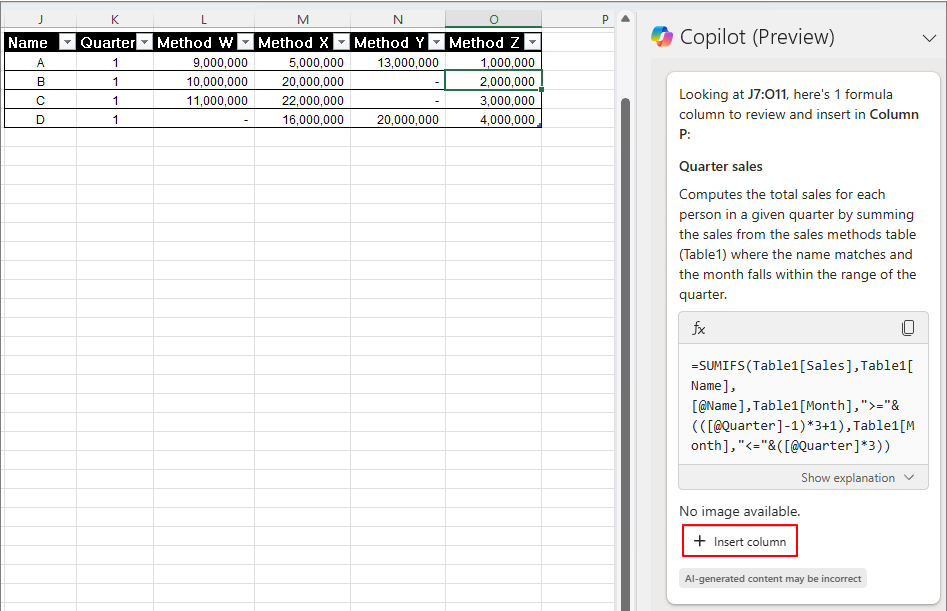
Using the same approach, let’s calculate the total sales by quarter.
Calculate "Quarter sales". Matching Name, Quarter based on Table1
Insert column
Confirm the result
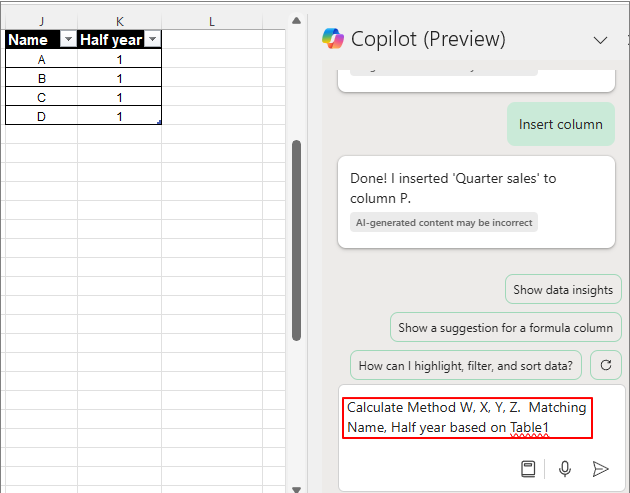
Using the same approach, let’s calculate the semi-annual performance.
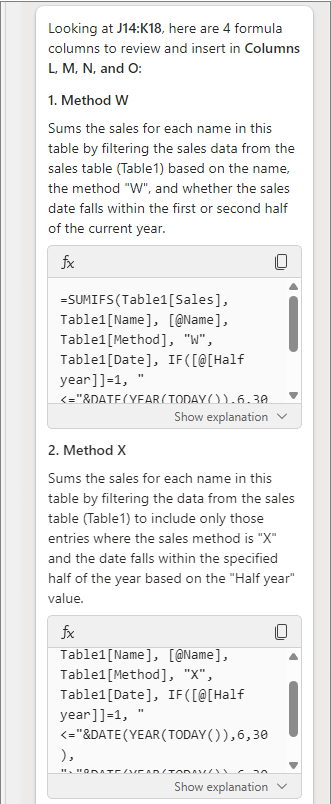
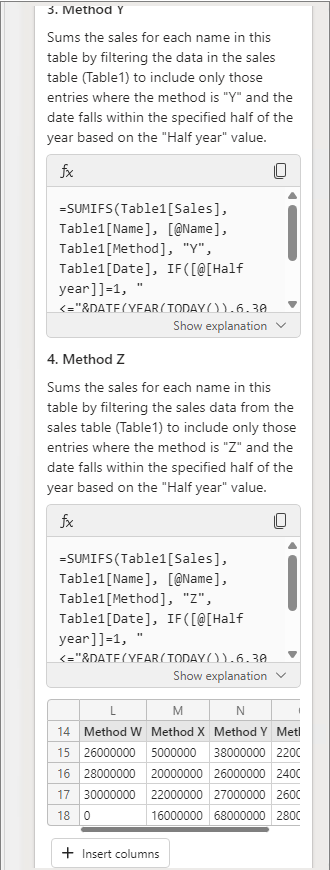
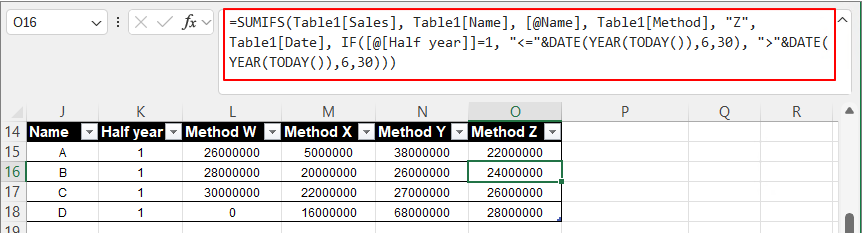
Calculate Method W, X, Y, Z. Matching Name, Half year based on Table1
Insert column
Confirm the result
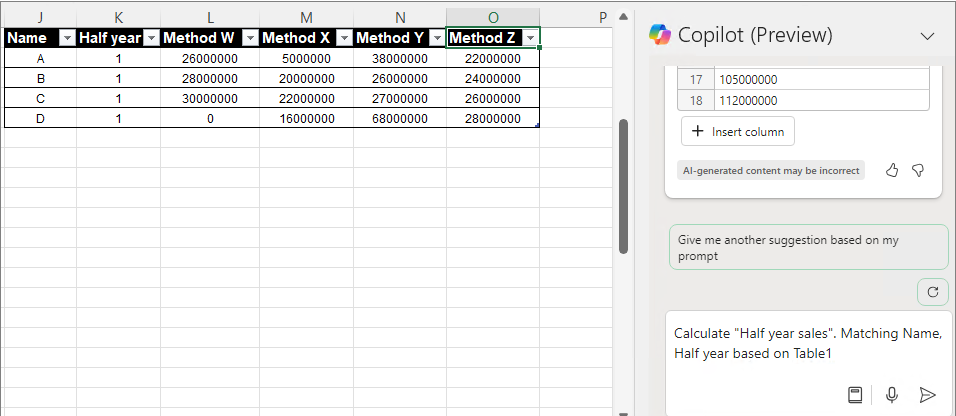
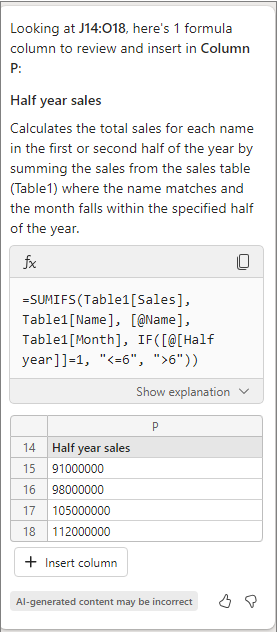
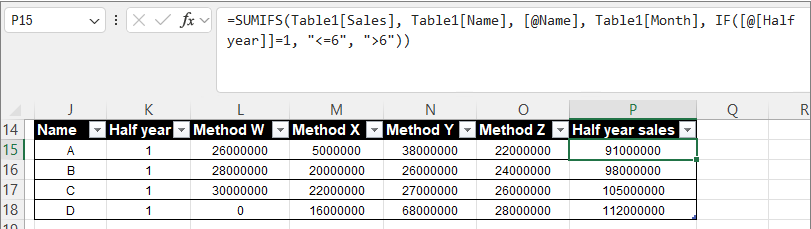
Calculate "Half year sales". Matching Name, Half year based on Table1
Insert column
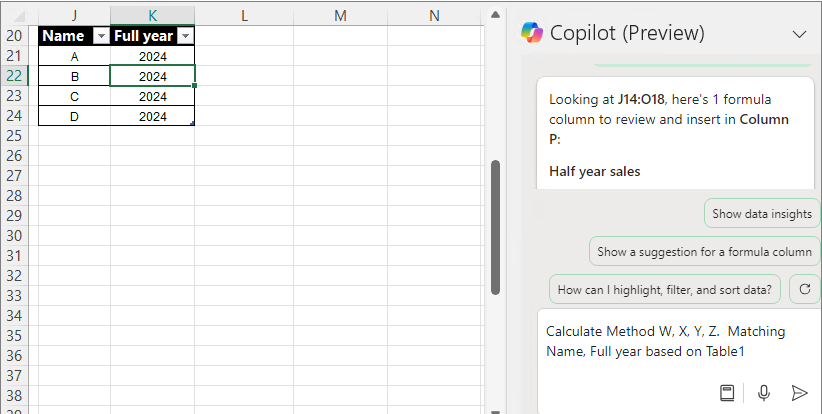
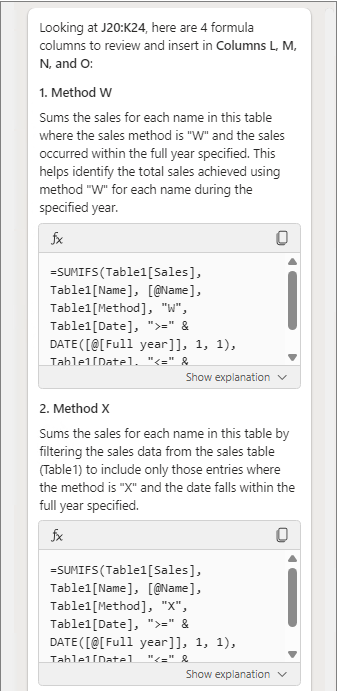
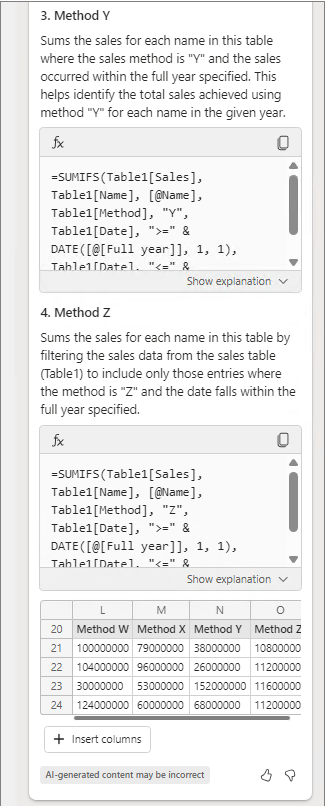
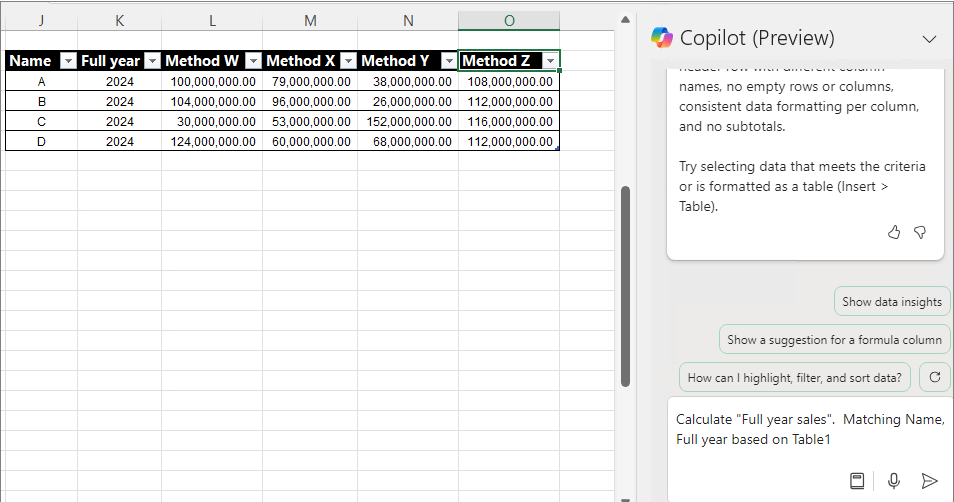
Calculate Method W, X, Y, Z. Matching Name, Full year based on Table1
Insert column
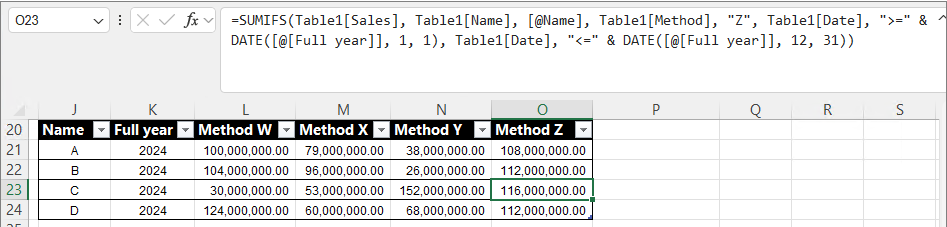
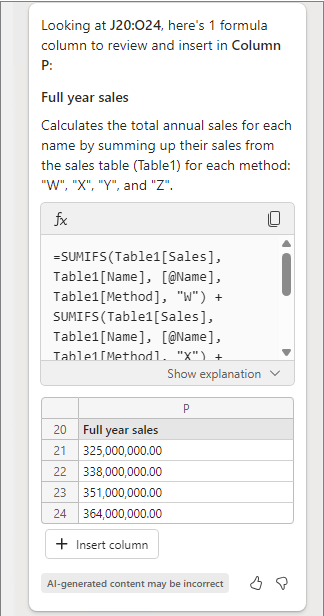
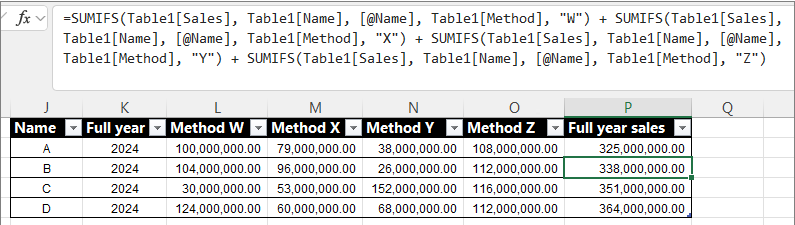
Calculate "Full year sales". Matching Name, Full year based on Table1.
Insert column
Confirm the result
With a simple prompt, you can see that complex formulas are completed.
It seems that the barrier to using Excel functions has been lowered compared to before.
I will continue to post about effective ways to utilize these features in the future.